Is I-poker rigged? Online Poker Watchdog - Analysis, Testing, Evidence.

Is Online Poker Rigged? Hands Tested, not just theories!
Is Online Poker Rigged?
Complete Tests:
Is Online Poker Rigged?
Test Results by Site:
Complete Tests:
Test Results by Site:
Online Poker Watchdog has carried out 'bad beat' tests on hands played at the I-Poker Network. The I-Poker Network is one of the largest online poker networks in the world and includes the major sites: William Hill Poker, Titan Poker, Winner Poker, Betfred Poker, Bet365, Gala Casino Poker and Paddy Power Poker. For a list of skins that run on the i-Poker Network see the I-Poker website.
We started by downloading a sample of 1 million hands from PTR*, importing into Poker Tracker and running a bad beat test (sample A).
The results of the test showed a bias in dominated hands that was greater than 3 standard deviations but less than 5 standard deviations. Therefore it was deemed necessary to carry out another test to see if the result was isolated or not.
Another million hands were purchased (sample B) - these hands were played at the same stakes and during a similar time period but at 6-max tables (the previous hands had been from full-ring games) and another bad beat test was run on these hands. Results from these hands were similar.
When samples A and B were analysed together and it was found that there was a bias in the sample of over 4.2 standard deviations. This should occur very rarely due to variance - roughly once in every 53,500 tests.
It was deemed necessary to carry out widespread testing. Widespread testing of over 16 million more hands from the i-Poker network was undertaken. No bias greater than 2.3 standard deviations was found in any of the further tests.
It was therefore concluded that i-Poker did not pass all tests because a significant bias was detected in isolated hand samples (samples A and B). However, a consistent bias was not present through a wide range of tables and games (samples C through H) and therefore it could not be concluded that i-Poker failed the bad beat test outright.
For further information see the conclusion and discussion sections below.
The bad beat tests run here are the same as the pre-flop bad beat tests previously run on other poker sites and networks. A full explanation can be seen here.
All samples were from the i-Poker network cash tables and were provided by PTR* and were of at least 1 million hands each.
Samples A and B were the original hand samples from FR and 6-max 5c/10c games.
Samples C, D and E are from hands played during similar time periods at different stakes and games, such as Head's Up games (2 players), 2c/4c and 10c/20c tables.
Sample F is a larger sample of 11.5 million hands at 6max tables of the same stakes as the original samples (5c/10c) over a 5 month period. Note that this period includes hands from sample B which will make up a small part (approximately 10%) of the overall sample F.
Samples G and H are from the same stakes (5c/10c) and games (6-max and FR) as the original sample but are from a completely different time period in 2012.
Full details of the hand samples are shown in this table:
| Sample | No. of Hands Sampled | Players | Stakes | Date Range |
|---|---|---|---|---|
| A | 1.10 million | 9 max | 5c/10c | 04 May '11 - 01 Jul '11 |
| B | 1.10 million | 6 max | 5c/10c | 20 Jun '11 - 11 Jul '11 |
| C | 1.10 million | 9 max | 2c4c | 31 Mar '11 - 16 Jul '11 |
| D | 1.10 million | 2 | 5c/10c | 22 May '11 - 14 Jul '11 |
| E | 1.10 million | 6 max | 10c/20c | 25 Jun '11 - 12 Jul '11 |
| F | 11.5 million | 6 max | 5c/10c | 25 Feb '11 - 22 Jul '11 |
| G | 1.1 million | 6 max | 5c/10c | 20 Apr '12 - 23 Jun '12 |
| H | 1.1 million | 9 max | 5c/10c | 2 Mar '12 - 22 Jun '12 |
Some screenshots were taken immediately after import to show the number of hand histories that were imported:
The data was filtered to remove all hands that were not 'heads up, pre-flop all-ins' - i.e. hands that were all-in pre-flop, with exactly 2 players involved in the all-in. There were a very small number of unusable hands due to errors - these were also removed. The number of all-ins are listed below:
| Sample | Number of All-ins (Heads-up, pre-flop) |
|---|---|
| A | 17,435 |
| B | 14,254 |
| C | 20,290 |
| D | 6,142 |
| E | 12,031 |
| F | 167,863 |
| G | 12,149 |
| H | 15,449 |
The method used to analyse the hands was the same as the methods used in other pre-flop bad beat tests. Full details can be seen at the method page.
Of particular note is the 'Dominated Hands' group - the sample is +3.38 standard deviations from the expected result in favour of the underdog. This result should occur due to variance in approximately 0.072% of tests (or roughly once in every 1380 tests).
| Data Group | Equity Range (%) | Total No. Hands | Expected No. Hands Won | Actual No. Hands Won | Actual Deviation | Standard Deviation | Number of Deviations from expectancy |
|---|---|---|---|---|---|---|---|
| All Hands | 0-100 | 17435 | 9157.3 | 9226.5 | +69.1 | 58.3 | +1.19 |
| Ahead | 50-100 | 9428 | 6687.3 | 6677.5 | -9.8 | 42.5 | -0.23 |
| Behind | 0-50 | 7998 | 2465.5 | 2544.5 | +79.0 | 39.9 | +1.98 |
| Dominating | 68-83 | 4965 | 3820.7 | 3835.5 | +14.8 | 29.5 | +0.50 |
| Dominated | 17-32 | 3928 | 913.1 | 1002 | +88.9 | 26.3 | +3.38 |
View full results for all-hands in pdf format
Of particular note are both the 'Dominated Hands' group and the 'Behind Hands' group - the samples are 2.78 and 2.85 standard deviations from the expected result in favour of the underdog, respectively. These result should occur due to variance in approximately 0.54% and 0.44% of tests respectively (or roughly once in every 184 and 230 tests respectively).
| Data Group | Equity Range (%) | Total No. Hands | Expected No. Hands Won | Actual No. Hands Won | Actual Deviation | Standard Deviation | Number of Deviations from expectancy |
|---|---|---|---|---|---|---|---|
| All Hands | 0-100 | 14254 | 7486.0 | 7584 | +98 | 53.8 | +1.82 |
| Ahead | 50-100 | 7704 | 5322.5 | 5315 | -7.5 | 39.2 | -0.19 |
| Behind | 0-50 | 6504 | 2158.5 | 2263.5 | +105.0 | 36.85 | +2.85 |
| Dominating | 68-83 | 3747 | 2853.7 | 2862 | +8.2 | 25.9 | +0.32 |
| Dominated | 17-32 | 2860 | 692.3 | 755.5 | +63.2 | 22.9 | +2.78 |
View full results for all-hands in pdf format
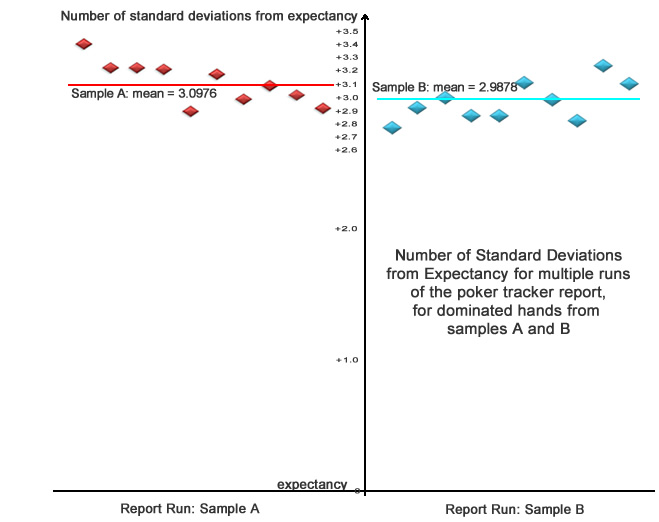
Since a considerable bias was found for dominated hands in both instances each test was repeated 10 times - this would enable any errors that were present due to the Monte Carlo to be reduced when an average of the 10 runs was calculated. A scatter graph of results for dominated hands in both samples is shown here:
Since the above results showed a degree of consistency in both samples and the hand samples were from identical stakes and during very similar time periods the samples were combined and another analysis was run. Effectively this analysis shows the likelihood that the above results should occur in two consecutive tests.
In order to minimise errors due to the Monte Carlo procedure, the data from the report that had results closest to the mean of the ten repeated runs was used. For sample A this was run 8 (number of standard deviations from expectancy = 3.072, mean = 3.098) and for sample B this was run 7 (number of standard deviations from expectancy = 2.995, mean = 2.989).
Dominated hands were focused on as this was were the greatest deviation occurred. The result shows a bias of over 4.2 standard deviations in favour of dominated hands. This result should occur due to variance in 0.0019% of tests or roughly once in every 53,504 tests.
| Data Group | Equity Range (%) | Total No. Hands | Expected No. Hands Won | Actual No. Hands Won | Actual Deviation | Standard Deviation | Number of Deviations from expectancy |
|---|---|---|---|---|---|---|---|
| Samples A and B, Dominated Hands | 17-32 | 6783 | 1065.7 | 1754.5 | +148.8 | 34.75 | +4.28 |
Sample C was from 2c4c games during a similar time period to samples A and B. Of particular note is the dominated hands result - the sample is +3.38 standard deviations from the expected result in favour of the underdog. This result should occur due to variance in approximately 2.3% of tests (or roughly once in every 43 tests).
| Data Group | Equity Range (%) | Total No. Hands | Expected No. Hands Won | Actual No. Hands Won | Actual Deviation | Standard Deviation | Number of Deviations from expectancy |
|---|---|---|---|---|---|---|---|
| All Hands | 0-100 | 20290 | 10797.9 | 10887.5 | +89.6 | 63.3 | +1.42 |
| Ahead | 50-100 | 11252 | 7951.2 | 7983 | +31.8 | 46.7 | +0.68 |
| Behind | 0-50 | 9028 | 2841.7 | 2899 | +57.3 | 42.7 | +1.34 |
| Dominating | 68-83 | 5792 | 4433.5 | 4483.5 | +50.0 | 32.0 | +1.56 |
| Dominated | 17-32 | 4215 | 991.9 | 1054 | 27.3 | 62.1 | +2.27 |
View results for all hands in pdf format
Sample D was from Heads-Up games (2 players) during a similar time period to samples A and B. All results are within 2 standard deviations of expectancy.
| Data Group | Equity Range (%) | Total No. Hands | Expected No. Hands Won | Actual No. Hands Won | Actual Deviation | Standard Deviation | Number of Deviations from expectancy |
|---|---|---|---|---|---|---|---|
| All Hands | 0-100 | 6142 | 3218.8 | 3258.5 | +39.7 | 36.1 | +1.10 |
| Ahead | 50-100 | 3317 | 2238.8 | 2263 | +24.2 | 26.36 | +0.92 |
| Behind | 0-50 | 2824 | 979.4 | 995 | +15.6 | 24.7 | +0.63 |
| Dominating | 68-83 | 1404 | 1049.8 | 1061.5 | +11.7 | 16.2 | +0.72 |
| Dominated | 17-32 | 1054 | 267.7 | 265.5 | -2.2 | 14.0 | -0.15 |
View results for all hands in PDF format
Sample E was from 10c20c games during a similar time period to samples A and B. We can see that in all cases the actual deviation is within 2 standard deviations of expectancy.
| Data Group | Equity Range (%) | Total No. Hands | Expected No. Hands Won | Actual No. Hands Won | Actual Deviation | Standard Deviation | Number of Deviations from expectancy |
|---|---|---|---|---|---|---|---|
| All Hands | 0-100 | 12031 | 6318.9 | 6338 | +19.1 | 49.4 | +0.39 |
| Ahead | 50-100 | 6468 | 4474.8 | 4472.5 | -2.3 | 35.9 | -0.06 |
| Behind | 0-50 | 5558 | 1841.6 | 1863 | +21.4 | 34.0 | +0.63 |
| Dominating | 68-83 | 3164 | 2412.7 | 2431 | +18.3 | 23.8 | +0.77 |
| Dominated | 17-32 | 2344 | 560.8 | 591.5 | +30.7 | 20.5 | +1.50 |
View results for all hands in PDF format
Sample F was a large sample of 11.5 million hands taken over a 5 month period at the same stakes as samples A and B (5c10c). We can see that in all cases the actual deviation was within 2 standard deviations from the expected result.
| Data Group | Equity Range (%) | Total No. Hands | Expected No. Hands Won | Actual No. Hands Won | Actual Deviation | Standard Deviation | Number of Deviations from expectancy |
|---|---|---|---|---|---|---|---|
| All Hands | 0-100 | 167863 | 87948.1 | 88276.5 | +328.4 | 184.8 | +1.78 |
| Ahead | 50-100 | 89858 | 62162.3 | 62272 | +109.7 | 134.0 | +0.82 |
| Behind | 0-50 | 77894 | 25730.3 | 25951.5 | +221.2 | 127.2 | +1.74 |
| Dominating | 68-83 | 43971 | 33458.3 | 33574 | +115.7 | 88.8 | +1.30 |
| Dominated | 17-32 | 33809 | 8180.1 | 8238.5 | +58.4 | 78.2 | +0.75 |
This hand sample is too large to store a PDF of the results for download.
Sample G is taken from the same stakes as samples A and B (5c10c) but in a different time period during 2012. Only results for 'dominated hands' and 'behind hands' were calculated as they were the significant results in samples A and B. All results are within 2 standard deviations of the expected result.
| Data Group | Equity Range (%) | Total No. Hands | Expected No. Hands Won | Actual No. Hands Won | Actual Deviation | Standard Deviation | Number of Deviations from expectancy |
|---|---|---|---|---|---|---|---|
| All Hands | 0-100 | 12149 | 6466.3 | 6490 | +23.7 | 49.7 | +0.48 |
| Behind | 0-50 | 5437 | 1809.6 | 1810 | +0.4 | 33.7 | +0.01 |
| Dominated | 17-32 | 2305 | 553.8 | 561.5 | +7.7 | 20.4 | +0.38 |
View results for all hands in PDF format
Sample H is taken from the same stakes as samples A and B (5c10c) but in a different time period during 2012. Only results for 'dominated hands' and 'behind hands' were calculated as they were the significant results in samples A and B. All results are within 2 standard deviations of the expected result.
| Data Group | Equity Range (%) | Total No. Hands | Expected No. Hands Won | Actual No. Hands Won | Actual Deviation | Standard Deviation | Number of Deviations from expectancy |
|---|---|---|---|---|---|---|---|
| All Hands | 0-100 | 15449 | 8194.9 | 8237 | +42.1 | 55.3 | +0.76 |
| Behind | 0-50 | 6981 | 2225.1 | 2266.5 | +41.4 | 37.6 | +1.10 |
| Dominated | 17-32 | 3230 | 756.0 | 749 | -7.0 | 23.9 | -0.29 |
View results for all hands in PDF format
A significant bias in the results for dominated hands was detected in samples A and B, which were taken at full ring and 6-max tables from identical stakes over similar time periods. The results shown would occur in both samples due to variance very rarely - approximately once in every 53,500 tests.
There were also significant deviations in favour of the underdog for 'behind hands' in samples A and B.
Also of note was a deviation of 2.27 standard deviations in sample C (where hands were from the same time period as samples A and B but at different stakes).
However, the other tests (including an 11.5 million hand sample over a 5 month time period) all showed results within 2 standard deviations of expectancy.
Due to the results from the tests on samples A and B it cannot be concluded that i-Poker has passed these bad beat tests. However, the bias shown in samples A and B was isolated and not consistent with results from the other samples which showed no bias and it therefore cannot be concluded that i-Poker has outright failed the bad beat test.
We can therefore conclude that i-Poker did not pass all tests because a significant bias was detected in isolated hand samples (samples A and B).
However, due to the isolated nature of the bias and no significant bias being found in the results of testing samples D to H we cannot conclude that the alternate hypothesis is true.
For general discussion of pre-flop bad beat tests see the discussion page. The discussion that follows will be specific to these tests on i-Poker hands.
The margin for error due to the Monte Carlo part of the Poker Tracker report was significantly reduced for the dominated hands test of samples A and B. This was achieved by running each test 10 times and then finding the mean result.
The results in samples A and B cannot be attributed to card removal effects as card removal effects should be reasonably consistent across all bad beat tests and the results of tests on samples A and B have not been witnessed in any other tests that have been run by Online Poker Watchdog.
The bias shown in favour of dominated hands in samples A and B is significant because it should occur very rarely due to variance. Specifically once in every 53,504 tests.
However, this does not necessarily mean that the bias is due to a rigged deal - there are many possible explanations as to why the bias exists. We will now speculate further as to possible underlying causes of the bias but please be aware that this is simply speculation.
1) The bias could be due to variance. This is unlikely (specifically 1 chance in 53,504) however that does not mean that it is impossible.
2) The bias could be due to rigging of the deal. However, this also seems unlikely because if this was the case the bias would likely be more widespread and show up fairly consistently in samples C, D, E, F, G, H. It could be argued that different dealing algorithms could be used for different stakes and games but that is a question that we cannot answer.
3) The bias could be due to widespread collusion at 5c10c 6max and full ring tables during May and June 2011. It has been suggested that players colluding would introduce a bias into the results of the bad beat tests since if a players holds AK, AQ etc. and was aware of that another player that they are colluding with also holds an ace or a king they would be unlikely to call an all-in from a third player.
If such collusion was widespread enough to influence the results of tests which are run over millions of hands it is likley that it is 'bots' that are colluding together rather than players that are colluding together.